Undersatanding PubMed GitHub repositories with the Software Gardening Almanack#
The content below seeks to better understand a dataset of ~10,000 PubMed article GitHub repositories using the Software Gardening Almanack.
PubMed GitHub repositories are extracted using the PubMed API to query for GitHub links within article abstracts. GitHub data about these repositories is gathered using the GitHub API. The code to perform data extractions may be found under the directory: gather-pubmed-repos .
These repositories are then processed using the Software Gardening Almanack to contextualize how they compare to one another.
Data Extraction#
The following section extracts data which includes software entropy and GitHub-derived data. We merge the data to form a table which includes PubMed, GitHub, and Almanack software entropy information on the repositories.
import pathlib

import numpy as np
import pandas as pd
import plotly.express as px
import plotly.io as pio
from IPython.display import Image, display

from almanack import process_repositories_batch

# set plotly default theme
pio.templates.default = "plotly_white"

# set almanack data directory
ALMANACK_DATA_DIR = "repository_analysis_results"
# if we don't already have a data dir, batch process almanack data
if not pathlib.Path(ALMANACK_DATA_DIR).is_dir():
    process_repositories_batch(
        # read pre-collected pubmeb github repos
        repo_urls=pd.read_parquet(
            path="gather-pubmed-repos/pubmed_github_links_with_github_data.parquet",
            columns=["github_link"],
        )
        .dropna()
        .github_link.tolist()[1:20],
        output_path=ALMANACK_DATA_DIR,
        split_batches=True,
        batch_size=500,
        max_workers=8,
        collect_dataframe=False,
        show_repo_progress=False,
        show_batch_progress=True,
    )

# read the dataset as a concenated dataframe from parquet chunks
df = pd.concat(
    [
        pd.read_parquet(pq_file)
        for pq_file in pathlib.Path(ALMANACK_DATA_DIR).glob("*.parquet")
    ],
    ignore_index=True,
    sort=False,
)
df.info()
<class 'pandas.core.frame.DataFrame'>
RangeIndex: 9631 entries, 0 to 9630
Data columns (total 62 columns):
 #   Column                                                    Non-Null Count  Dtype
---  ------                                                    --------------  -----
 0   Repository URL                                            9631 non-null   object
 1   repo-path                                                 9631 non-null   object
 2   repo-commits                                              9587 non-null   float64
 3   repo-file-count                                           9587 non-null   float64
 4   repo-commit-time-range                                    9631 non-null   object
 5   repo-days-of-development                                  9587 non-null   float64
 6   repo-commits-per-day                                      9587 non-null   float64
 7   almanack-table-datetime                                   9631 non-null   object
 8   almanack-version                                          9631 non-null   object
 9   repo-primary-language                                     5789 non-null   object
 10  repo-primary-license                                      3503 non-null   object
 11  repo-doi                                                  125 non-null    object
 12  repo-doi-publication-date                                 107 non-null    object
 13  repo-doi-fwci                                             46 non-null     float64
 14  repo-doi-is-not-retracted                                 75 non-null     float64
 15  repo-doi-grants-count                                     84 non-null     float64
 16  repo-doi-grants                                           0 non-null      object
 17  repo-includes-readme                                      9587 non-null   float64
 18  repo-includes-contributing                                9587 non-null   float64
 19  repo-includes-code-of-conduct                             9587 non-null   float64
 20  repo-includes-license                                     9587 non-null   float64
 21  repo-is-citable                                           9587 non-null   float64
 22  repo-default-branch-not-master                            9587 non-null   float64
 23  repo-includes-common-docs                                 9587 non-null   float64
 24  repo-unique-contributors                                  9587 non-null   float64
 25  repo-unique-contributors-past-year                        9587 non-null   float64
 26  repo-unique-contributors-past-182-days                    9587 non-null   float64
 27  repo-tags-count                                           9587 non-null   float64
 28  repo-tags-count-past-year                                 9587 non-null   float64
 29  repo-tags-count-past-182-days                             9587 non-null   float64
 30  repo-stargazers-count                                     6024 non-null   float64
 31  repo-uses-issues                                          6024 non-null   float64
 32  repo-issues-open-count                                    6024 non-null   float64
 33  repo-pull-requests-enabled                                6024 non-null   float64
 34  repo-forks-count                                          6024 non-null   float64
 35  repo-subscribers-count                                    6024 non-null   float64
 36  repo-packages-ecosystems-count                            9587 non-null   float64
 37  repo-packages-versions-count                              9587 non-null   float64
 38  repo-social-media-platforms-count                         9295 non-null   float64
 39  repo-doi-valid-format                                     90 non-null     float64
 40  repo-doi-https-resolvable                                 84 non-null     float64
 41  repo-doi-cited-by-count                                   75 non-null     float64
 42  repo-days-between-doi-publication-date-and-latest-commit  75 non-null     float64
 43  repo-gh-workflow-success-ratio                            463 non-null    float64
 44  repo-gh-workflow-succeeding-runs                          463 non-null    float64
 45  repo-gh-workflow-failing-runs                             463 non-null    float64
 46  repo-gh-workflow-queried-total                            463 non-null    float64
 47  repo-code-coverage-percent                                0 non-null      object
 48  repo-date-of-last-coverage-run                            0 non-null      object
 49  repo-days-between-last-coverage-run-latest-commit         0 non-null      object
 50  repo-code-coverage-total-lines                            0 non-null      object
 51  repo-code-coverage-executed-lines                         0 non-null      object
 52  repo-agg-info-entropy                                     9587 non-null   float64
 53  repo-almanack-score_json                                  9631 non-null   object
 54  repo-packages-ecosystems_json                             9631 non-null   object
 55  repo-social-media-platforms_json                          9631 non-null   object
 56  checks_total                                              9587 non-null   float64
 57  checks_passed                                             9587 non-null   float64
 58  checks_pct                                                9587 non-null   float64
 59  repo-social-media-platforms                               0 non-null      float64
 60  almanack_error                                            6000 non-null   object
 61  repo-doi-grants_json                                      4200 non-null   object
dtypes: float64(42), object(20)
memory usage: 4.6+ MB
/tmp/ipykernel_3444/2236761407.py:21: FutureWarning: The behavior of DataFrame concatenation with empty or all-NA entries is deprecated. In a future version, this will no longer exclude empty or all-NA columns when determining the result dtypes. To retain the old behavior, exclude the relevant entries before the concat operation.
  df = pd.concat(
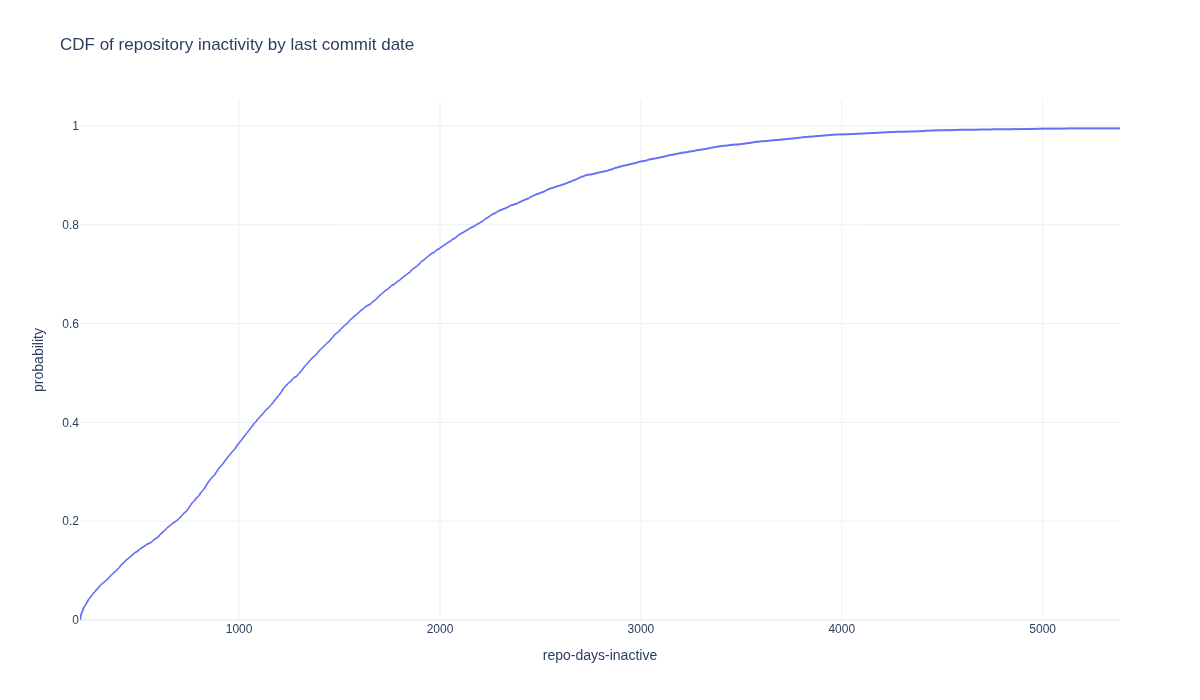
How many repositories are dormant?#
Software must evolve continuously to remain stable, useful, and aligned with current needs. The following section explores how repository dormancy appears within the dataset based on the date of most recent commit. Sustained, incremental updates help prevent this stagnation and ensure that a project continues to serve its users effectively.
# cleanup: drop columns or rows whose values are all empty
df = df.dropna(axis=1, how="all")
df = df.dropna(axis=0, how="all")
# gather repo commit start and end dates
df[["repo-commit-start-date", "repo-commit-end-date"]] = df[
    "repo-commit-time-range"
].str.extract(r"\('([^']+)', '([^']+)'\)")
# turn these into datetimes for datetime calcs
df[["repo-commit-start-date", "repo-commit-end-date"]] = df[
    ["repo-commit-start-date", "repo-commit-end-date"]
].apply(pd.to_datetime)
# set a cuttoff of 1 year for dormancy
cutoff = pd.Timestamp.now() - pd.DateOffset(years=1)
df["dormant"] = df["repo-commit-end-date"] <= cutoff
# show how many dormant repos there are in this dataset
df["dormant"].value_counts()
dormant
True     8708
False     923
Name: count, dtype: int64
df["repo-days-of-existence"] = (
    pd.Timestamp.now() - df["repo-commit-start-date"]
).dt.days
df["repo-days-inactive"] = (pd.Timestamp.now() - df["repo-commit-end-date"]).dt.days
fig = px.ecdf(
    df,
    x="repo-days-inactive",
    title="CDF of repository inactivity by last commit date",
    width=1200,
    height=700,
)
fig.write_image(
    image_file := "images/cdf_repository_inactivity_by_last_commit_date.png"
)
display(Image(filename=image_file))
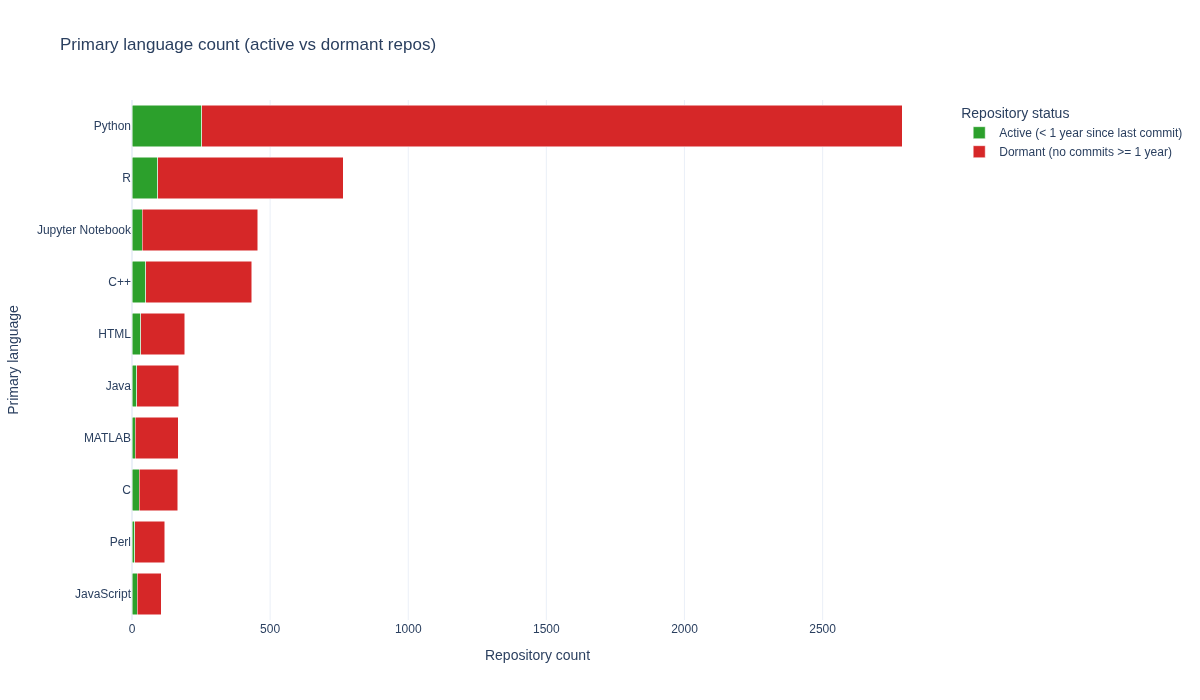
What languages are used within PubMed article repositories?#
The following section observes the top 10 languages which are used in repositories from the dataset. Primary language is determined as the language which has the most lines of code within a repository.
# Count dormant & active repos per language
lang_status = (
    df.groupby(["repo-primary-language", "dormant"]).size().reset_index(name="Count")
)

# Map boolean to readable labels
lang_status["Status"] = lang_status["dormant"].map(
    {
        True: "Dormant (no commits >= 1 year)",
        False: "Active (< 1 year since last commit)",
    }
)

# Total repos per language
total_counts = lang_status.groupby("repo-primary-language")["Count"].sum()

# Top 10 languages by total repo count (sorted)
top_langs = total_counts.sort_values().tail(10)

# Filter to top languages
plot_data = lang_status[
    lang_status["repo-primary-language"].isin(top_langs.index)
].copy()

# Ensure y-axis follows the sorted order by total count
lang_order = top_langs.index.tolist()
plot_data["repo-primary-language"] = pd.Categorical(
    plot_data["repo-primary-language"],
    categories=lang_order,
    ordered=True,
)

# Stacked horizontal bar chart: Active (green) + Dormant (red)
fig = px.bar(
    plot_data,
    y="repo-primary-language",
    x="Count",
    color="Status",
    orientation="h",
    color_discrete_map={
        "Active (< 1 year since last commit)": "#2ca02c",
        "Dormant (no commits >= 1 year)": "#d62728",
    },
    width=1200,
    height=700,
    title="Primary language count (active vs dormant repos)",
)

fig.update_layout(
    barmode="stack",
    xaxis_title="Repository count",
    yaxis_title="Primary language",
    legend_title="Repository status",
    yaxis=dict(categoryorder="array", categoryarray=lang_order),
)


fig.write_image(image_file := "images/primary-language-counts.png")
display(Image(filename=image_file))
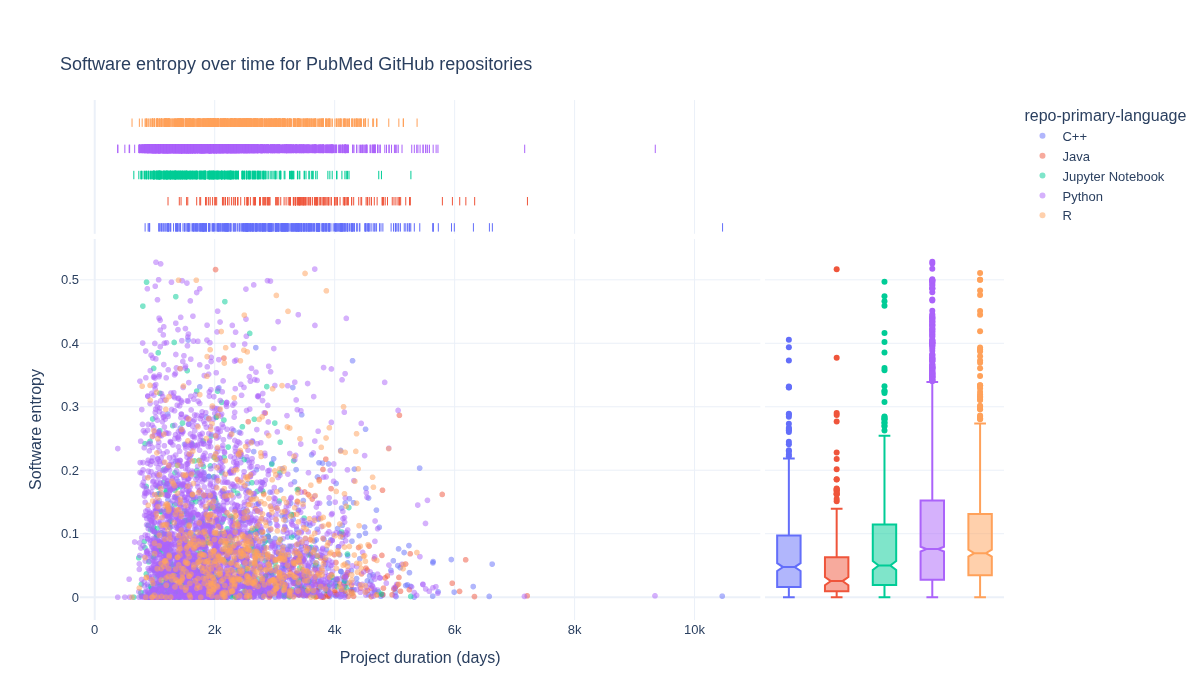
How is software entropy different across primary languages?#
The following section explores how software entropy manifests differently across different primary languages for repositories.
language_grouped_data = (
    df.groupby(["repo-primary-language"]).size().reset_index(name="Count")
)

fig = px.scatter(
    df[
        df["repo-primary-language"].isin(
            language_grouped_data
            # exclude HTML to focus on formal programming languages
            .loc[
                ~language_grouped_data["repo-primary-language"].str.contains(
                    "html", case=False, na=False
                )
            ].sort_values(by="Count")[-5:]["repo-primary-language"]
        )
    ].sort_values(by="repo-primary-language"),
    x="repo-days-of-existence",
    y="repo-agg-info-entropy",
    hover_data=["Repository URL"],
    width=1200,
    height=700,
    title="Software entropy over time for PubMed GitHub repositories",
    marginal_x="rug",
    marginal_y="box",
    opacity=0.5,
    color="repo-primary-language",
)

fig.update_layout(
    font=dict(size=13),
    title={"yref": "container", "y": 0.9, "yanchor": "bottom"},
    xaxis_title="Project duration (days)",
    yaxis_title="Software entropy",
)
fig.write_image(image_file := "images/software-information-entropy-top-5-langs.png")
display(Image(filename=image_file))
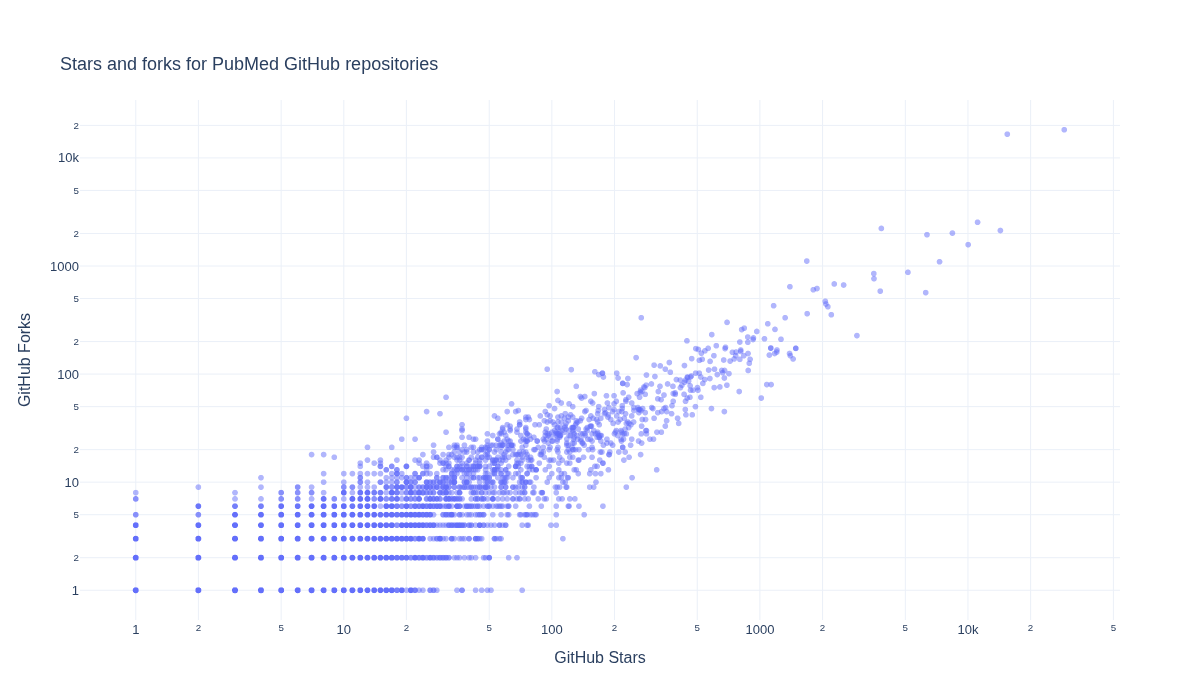
What is the relationship between GitHub Stars and Forks for repositories?#
We next explore how GitHub Stars and Forks are related within the repositories.
fig = px.scatter(
    df,
    x="repo-stargazers-count",
    y="repo-forks-count",
    hover_data=["Repository URL"],
    width=1200,
    height=700,
    title="Stars and forks for PubMed GitHub repositories",
    opacity=0.5,
    log_y=True,
    log_x=True,
)

fig.update_layout(
    font=dict(size=13),
    title={"yref": "container", "y": 0.9, "yanchor": "bottom"},
    xaxis_title="GitHub Stars",
    yaxis_title="GitHub Forks",
)
fig.write_image(image_file := "images/pubmed-stars-and-forks.png")
display(Image(filename=image_file))
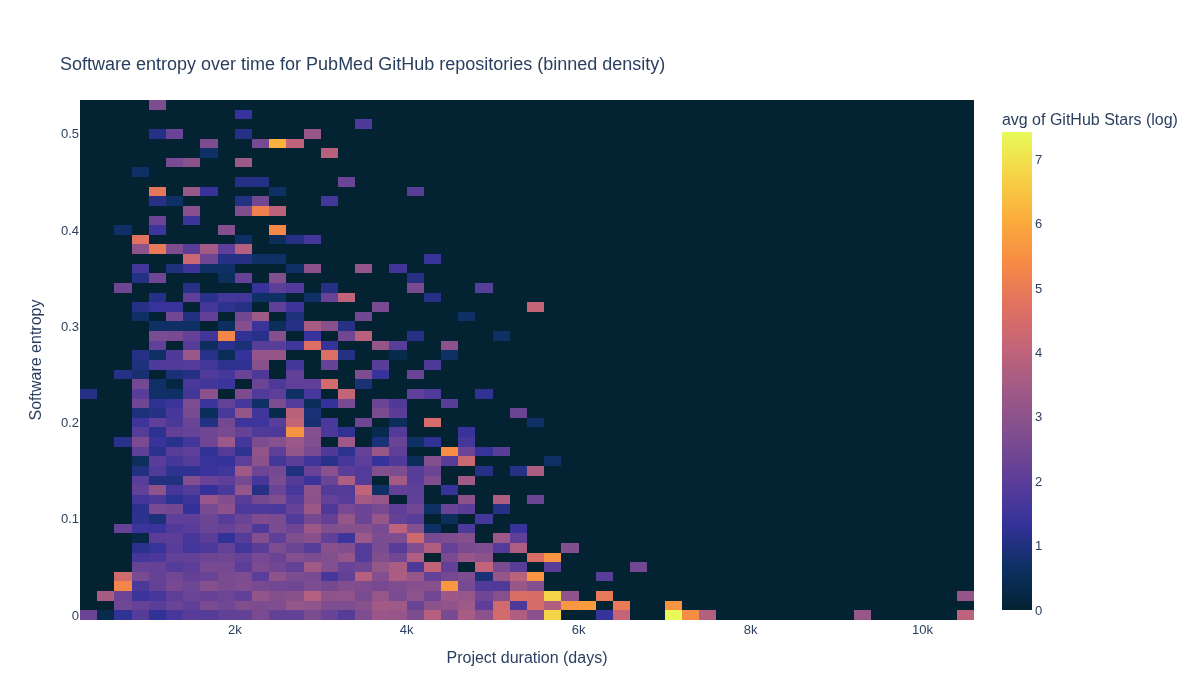
How do GitHub Stars, software entropy, and time relate?#
The next section explores how GitHub Stars, software entropy, and time relate to one another.
df["GitHub Stars (log)"] = np.log(
    df["repo-stargazers-count"].apply(lambda x: x if x > 0 else None)  # avoid log(0)
)

df_plot = df.dropna(subset=["GitHub Stars (log)"])

fig = px.density_heatmap(
    df_plot,
    x="repo-days-of-existence",
    y="repo-agg-info-entropy",
    z="GitHub Stars (log)",  # aggregate value per bin
    histfunc="avg",  # mean log stars per bin (could use "sum" or "count")
    nbinsx=60,
    nbinsy=60,
    color_continuous_scale=px.colors.sequential.thermal,
    hover_data=["Repository URL"],
    width=1200,
    height=700,
    title="Software entropy over time for PubMed GitHub repositories (binned density)",
)

fig.update_layout(
    font=dict(size=13),
    title={"yref": "container", "y": 0.9, "yanchor": "bottom"},
    xaxis_title="Project duration (days)",
    yaxis_title="Software entropy",
)
fig.write_image(image_file := "images/software-information-entropy-gh-stars.png")
display(Image(filename=image_file))
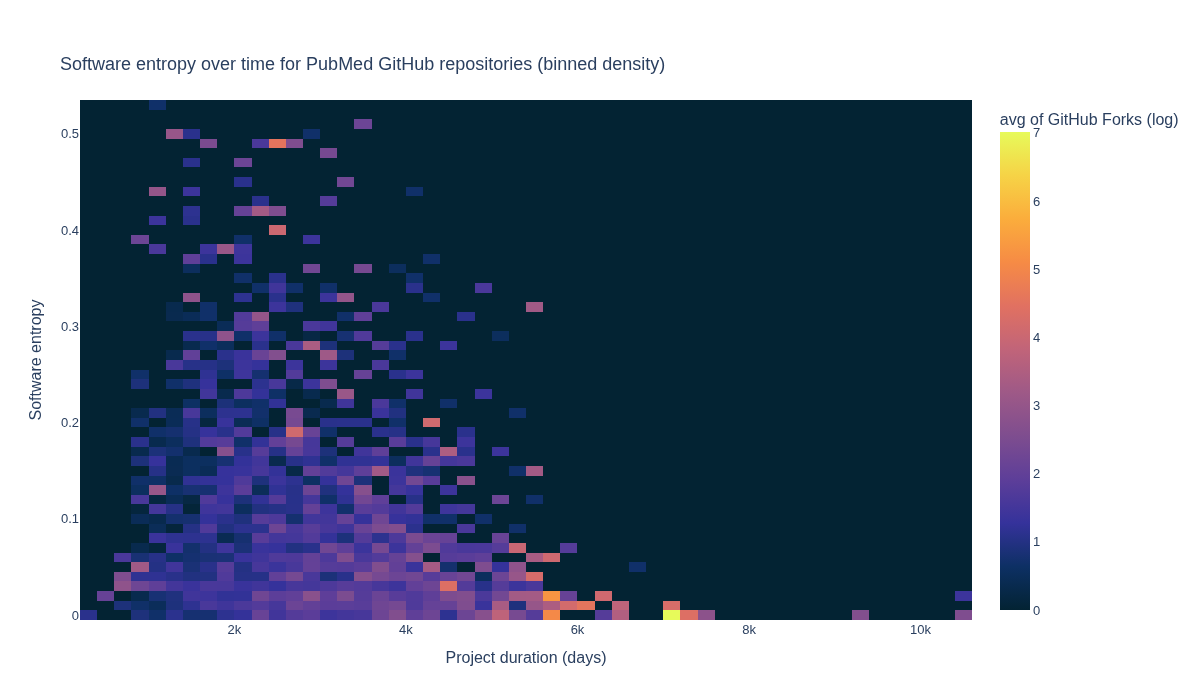
How do GitHub Forks, software entropy, and time relate?#
The next section explores how GitHub Forks, software entropy, and time relate to one another.
df["GitHub Forks (log)"] = np.log(
    df["repo-forks-count"].apply(
        # move 0's to None to avoid log(0)
        lambda x: x if x > 0 else None
    )
)

# Drop rows with missing values in the relevant columns
df_plot = df.dropna(
    subset=["GitHub Forks (log)", "repo-days-of-existence", "repo-agg-info-entropy"]
)

fig = px.density_heatmap(
    df_plot,
    x="repo-days-of-existence",
    y="repo-agg-info-entropy",
    z="GitHub Forks (log)",  # value to aggregate per bin
    histfunc="avg",  # mean log forks per bin (can use "sum" or "count")
    nbinsx=60,
    nbinsy=60,
    color_continuous_scale=px.colors.sequential.thermal,
    width=1200,
    height=700,
    title="Software entropy over time for PubMed GitHub repositories (binned density)",
)

fig.update_layout(
    font=dict(size=13),
    title={"yref": "container", "y": 0.9, "yanchor": "bottom"},
    xaxis_title="Project duration (days)",
    yaxis_title="Software entropy",
)
fig.write_image(image_file := "images/software-information-entropy-forks.png")
display(Image(filename=image_file))
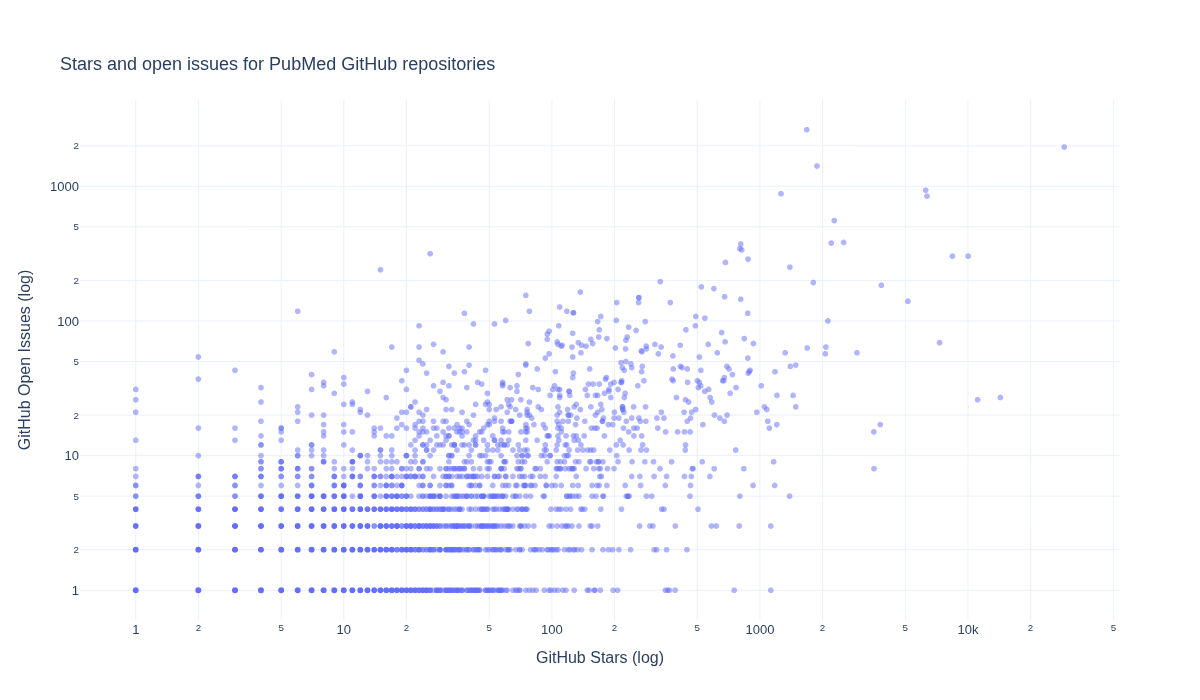
What is the relationship between GitHub Stars and Open Issues for the repositories?#
Below we explore how GitHub Stars and Open Issues are related for the repositories.
df["GitHub Open Issues (log)"] = np.log(
    df["repo-issues-open-count"].apply(
        # move 0's to None to avoid divide by 0
        lambda x: x if x > 0 else None
    )
)

fig = px.scatter(
    df,
    x="repo-stargazers-count",
    y="repo-issues-open-count",
    hover_data=["Repository URL"],
    width=1200,
    height=700,
    title="Stars and open issues for PubMed GitHub repositories",
    opacity=0.5,
    log_y=True,
    log_x=True,
)

fig.update_layout(
    font=dict(size=13),
    title={"yref": "container", "y": 0.9, "yanchor": "bottom"},
    xaxis_title="GitHub Stars (log)",
    yaxis_title="GitHub Open Issues (log)",
)
fig.write_image(image_file := "images/pubmed-stars-and-open-issues.png")
display(Image(filename=image_file))
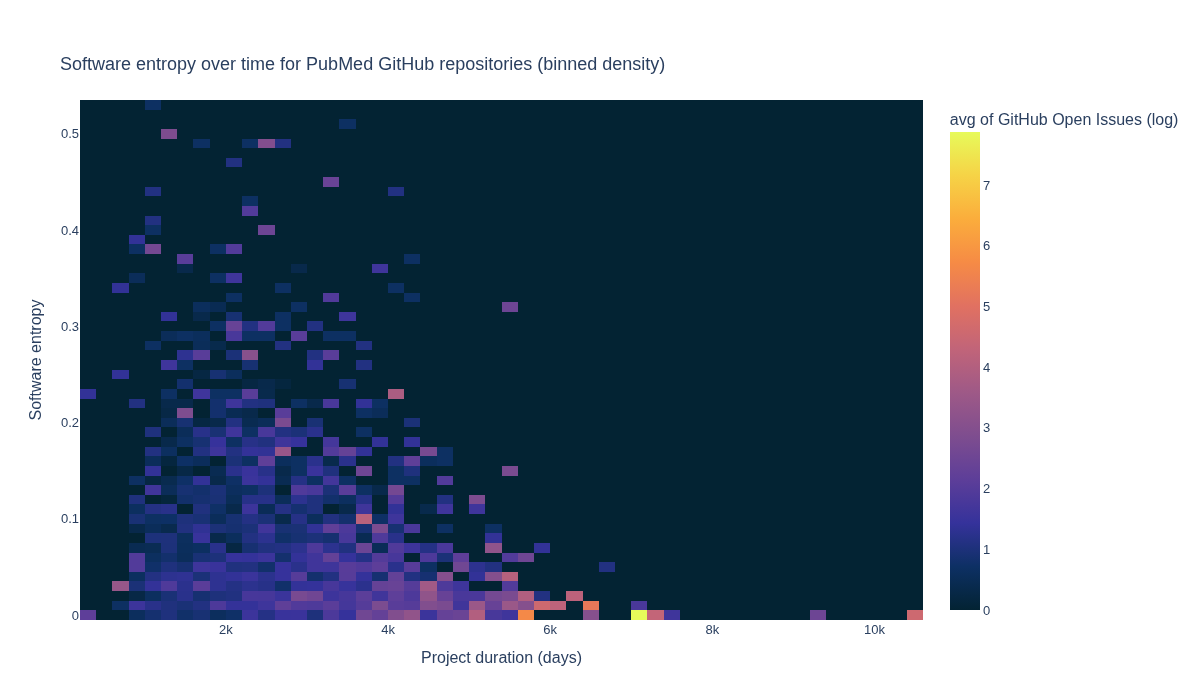
How do software entropy, time, and GitHub issues relate to one another?#
The next section visualizes how software entropy, time, and GitHub issues relate to one another.
df["GitHub Open Issues (log)"] = np.log(
    df["repo-issues-open-count"].apply(
        # move 0's to None to avoid log(0)
        lambda x: x if x > 0 else None
    )
)

# Drop rows with missing values in the relevant columns
df_plot = df.dropna(
    subset=[
        "GitHub Open Issues (log)",
        "repo-days-of-existence",
        "repo-agg-info-entropy",
    ]
)

fig = px.density_heatmap(
    df_plot,
    x="repo-days-of-existence",
    y="repo-agg-info-entropy",
    z="GitHub Open Issues (log)",  # value to aggregate per bin
    histfunc="avg",  # mean log open issues per bin
    nbinsx=60,
    nbinsy=60,
    color_continuous_scale=px.colors.sequential.thermal,
    width=1200,
    height=700,
    title="Software entropy over time for PubMed GitHub repositories (binned density)",
)

fig.update_layout(
    font=dict(size=13),
    title={"yref": "container", "y": 0.9, "yanchor": "bottom"},
    xaxis_title="Project duration (days)",
    yaxis_title="Software entropy",
)

fig.write_image(image_file := "images/software-information-entropy-open-issues.png")
display(Image(filename=image_file))